The Motor Test Stand Project was created to test the small coreless motors used in small RC drones, specifically the 8520 (8.5mm x 20mm) one, with different propeller sizes. This for both the Drone project and also for future small and simple plains or other flying RC projects. All the analog signal conditioning and conversion is done by the STM32G4 DAQ. This simplifies and speeds up the development of both the hardware and software significantly. The electronics is very simple due to this, no additional components besides the sensing elements are needed. The software uses the already developed C# library for the STM32G4 DAQ, only the GUI part had to be implemented.
The test stand is built in a way so that the motor holder can be exchanged and replaced with a different one for other motor types and sizes. The whole test stand is semi-automatic, it measures not only the thrust but also the voltage and current applied to the motor under test. The only manual operation is to change the applied voltage.
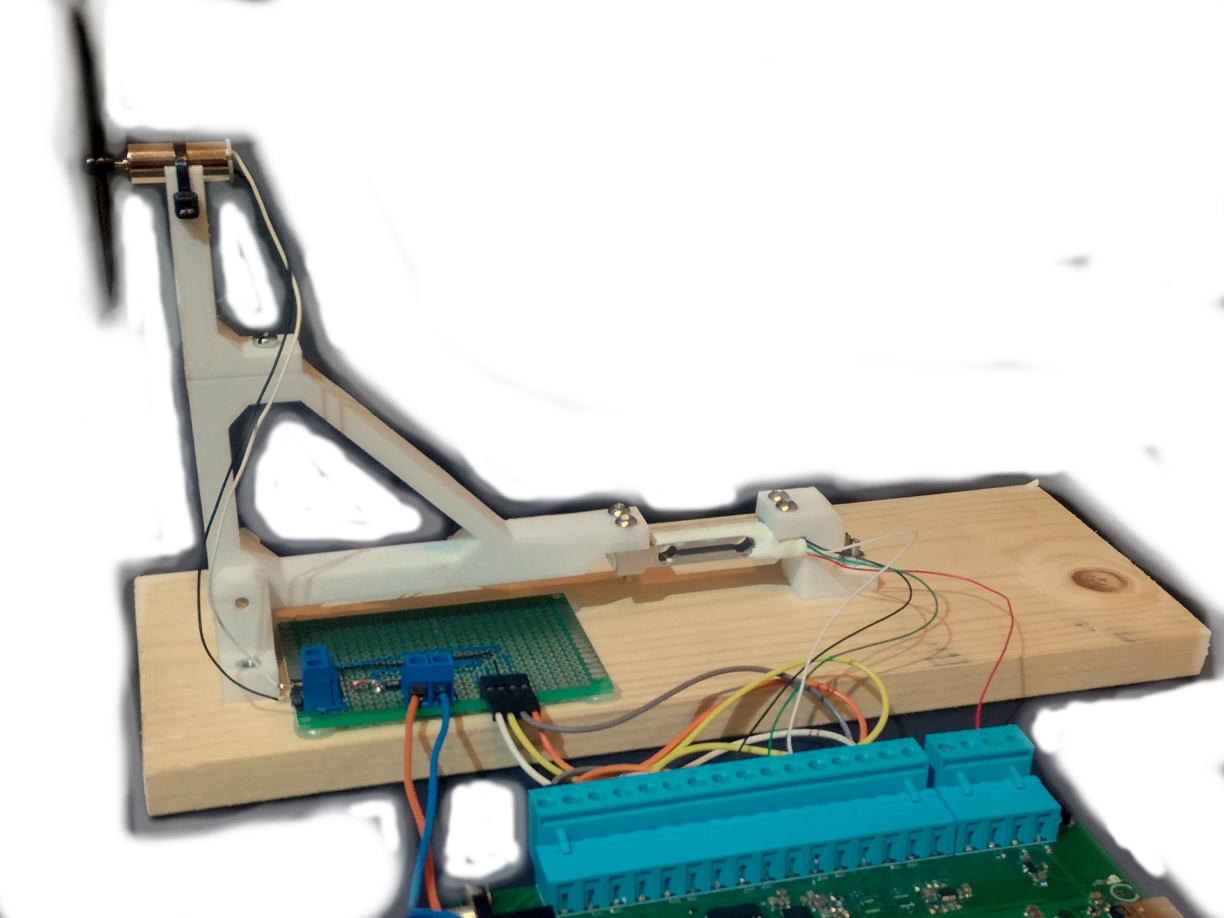
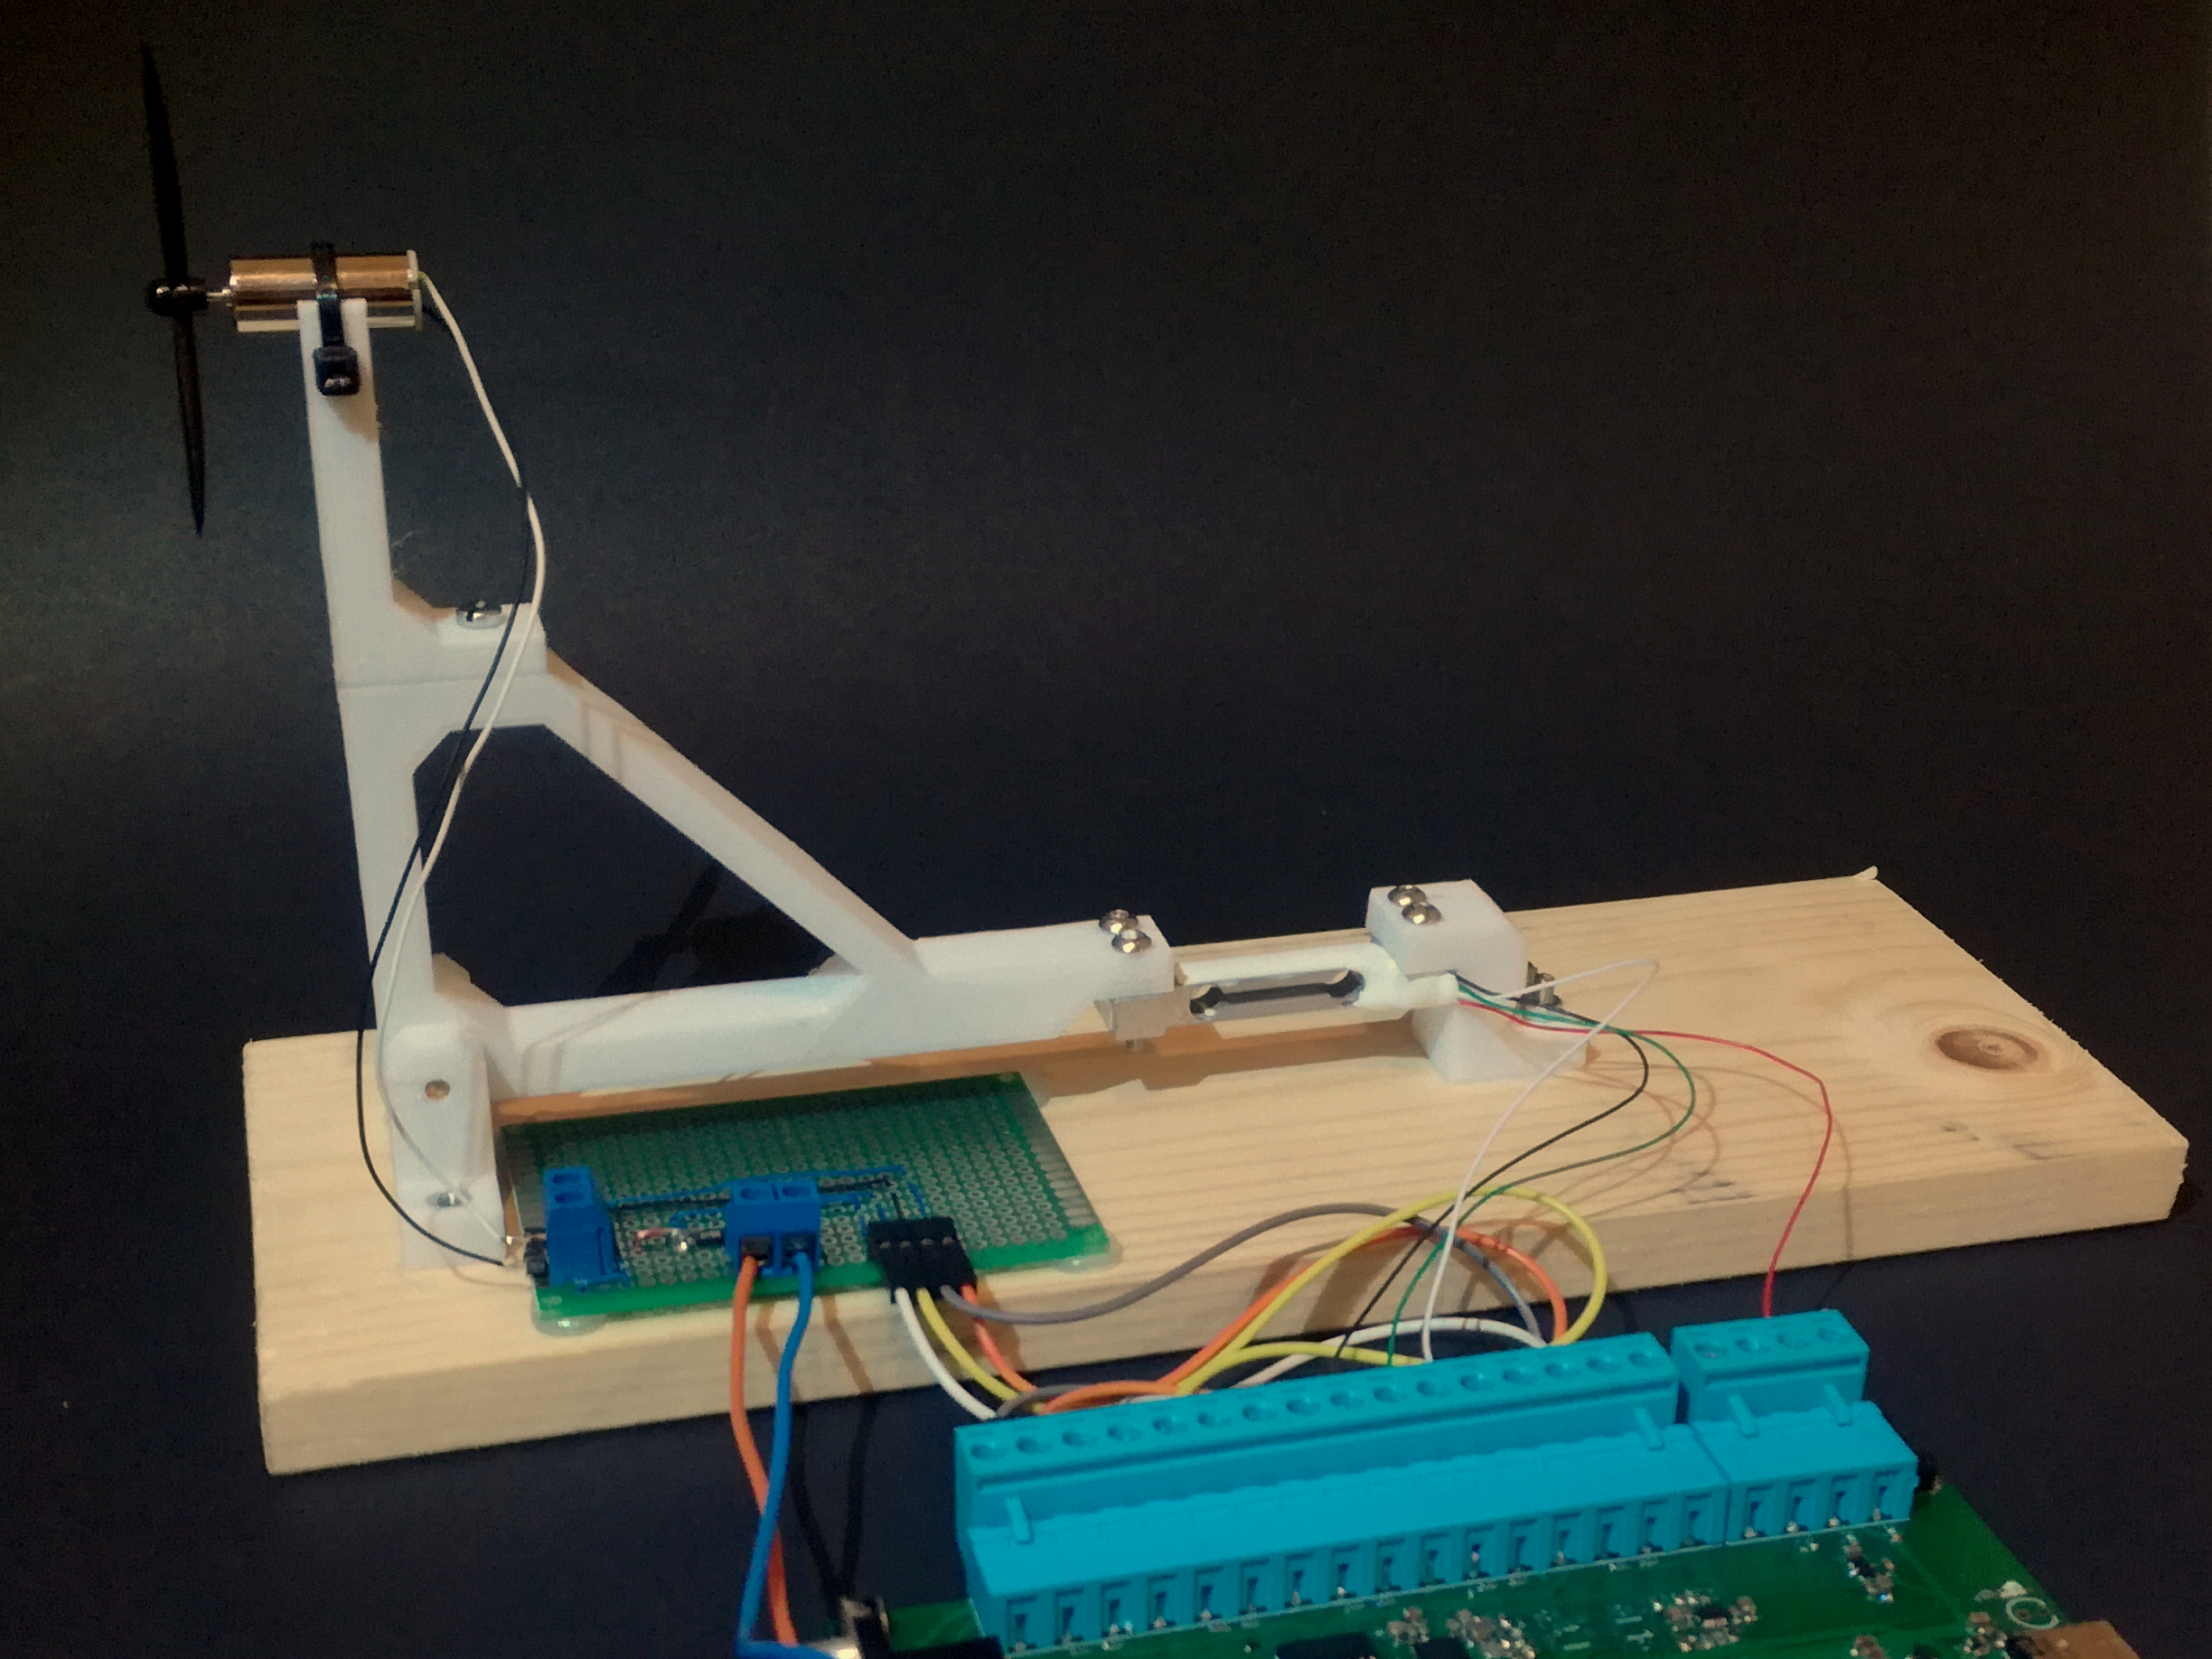
Structure (3D Printed)
To transfer the force/thrust of the motor + propeller a hinged arm is used. The arm has an equal length from the pivot point to the motor center, the thrust force center, and to the strain gauge mounting holes. This guarantees a 1:1 force transfer from the motor to the strain gauge, when disregarding losses due to friction in the pivot point and losses to to ductility of the printed plastic parts. The 3D render of all pieces can be seen in the figure bellow:
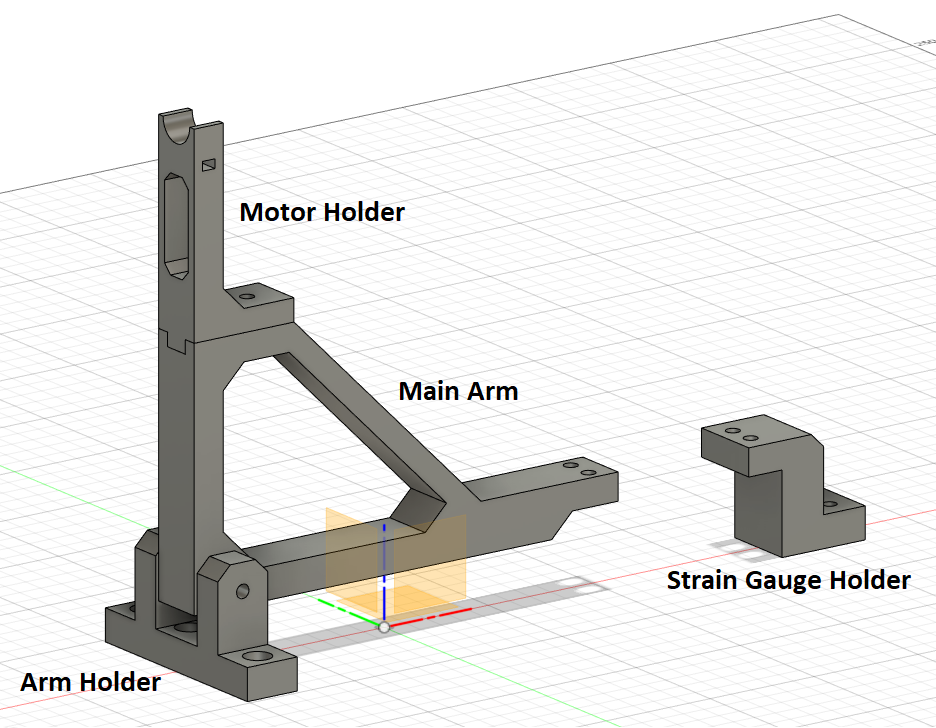
The arm is composed of two parts, the Main Arm and a Motor Holder piece, which is fixed with a M3 bolt to the main arm piece. This way the motor holder can easily be exchanged with holders for other motors. It has a large opening in the front for reduced air “drag”. The pivot point of the arm is fixed in place with the Arm Holder and a 3mm brass rod. The main arm piece has two ball bearings (683ZZ) so that it can rotate on the brass rod, the pivot point.
The arm is fixed to the strain gauge with two M3 bolts and the strain gauge in turn is mounted to the base with the Strain Gauge Holder, also with two M3 bolts. Both the arm holder and the strain gauge holder are fixed down to the baseplate, a slap of wood (9cm x 25cm) here, with M3 bolts and M3 nuts that are pressed into the plastic pieces.
All four plastic parts were 3D printed with PETG. The 3D files, in STL format, can be downloaded from bellow:
3D Files: Motor_Test_Stand_STL.zip
Circuit
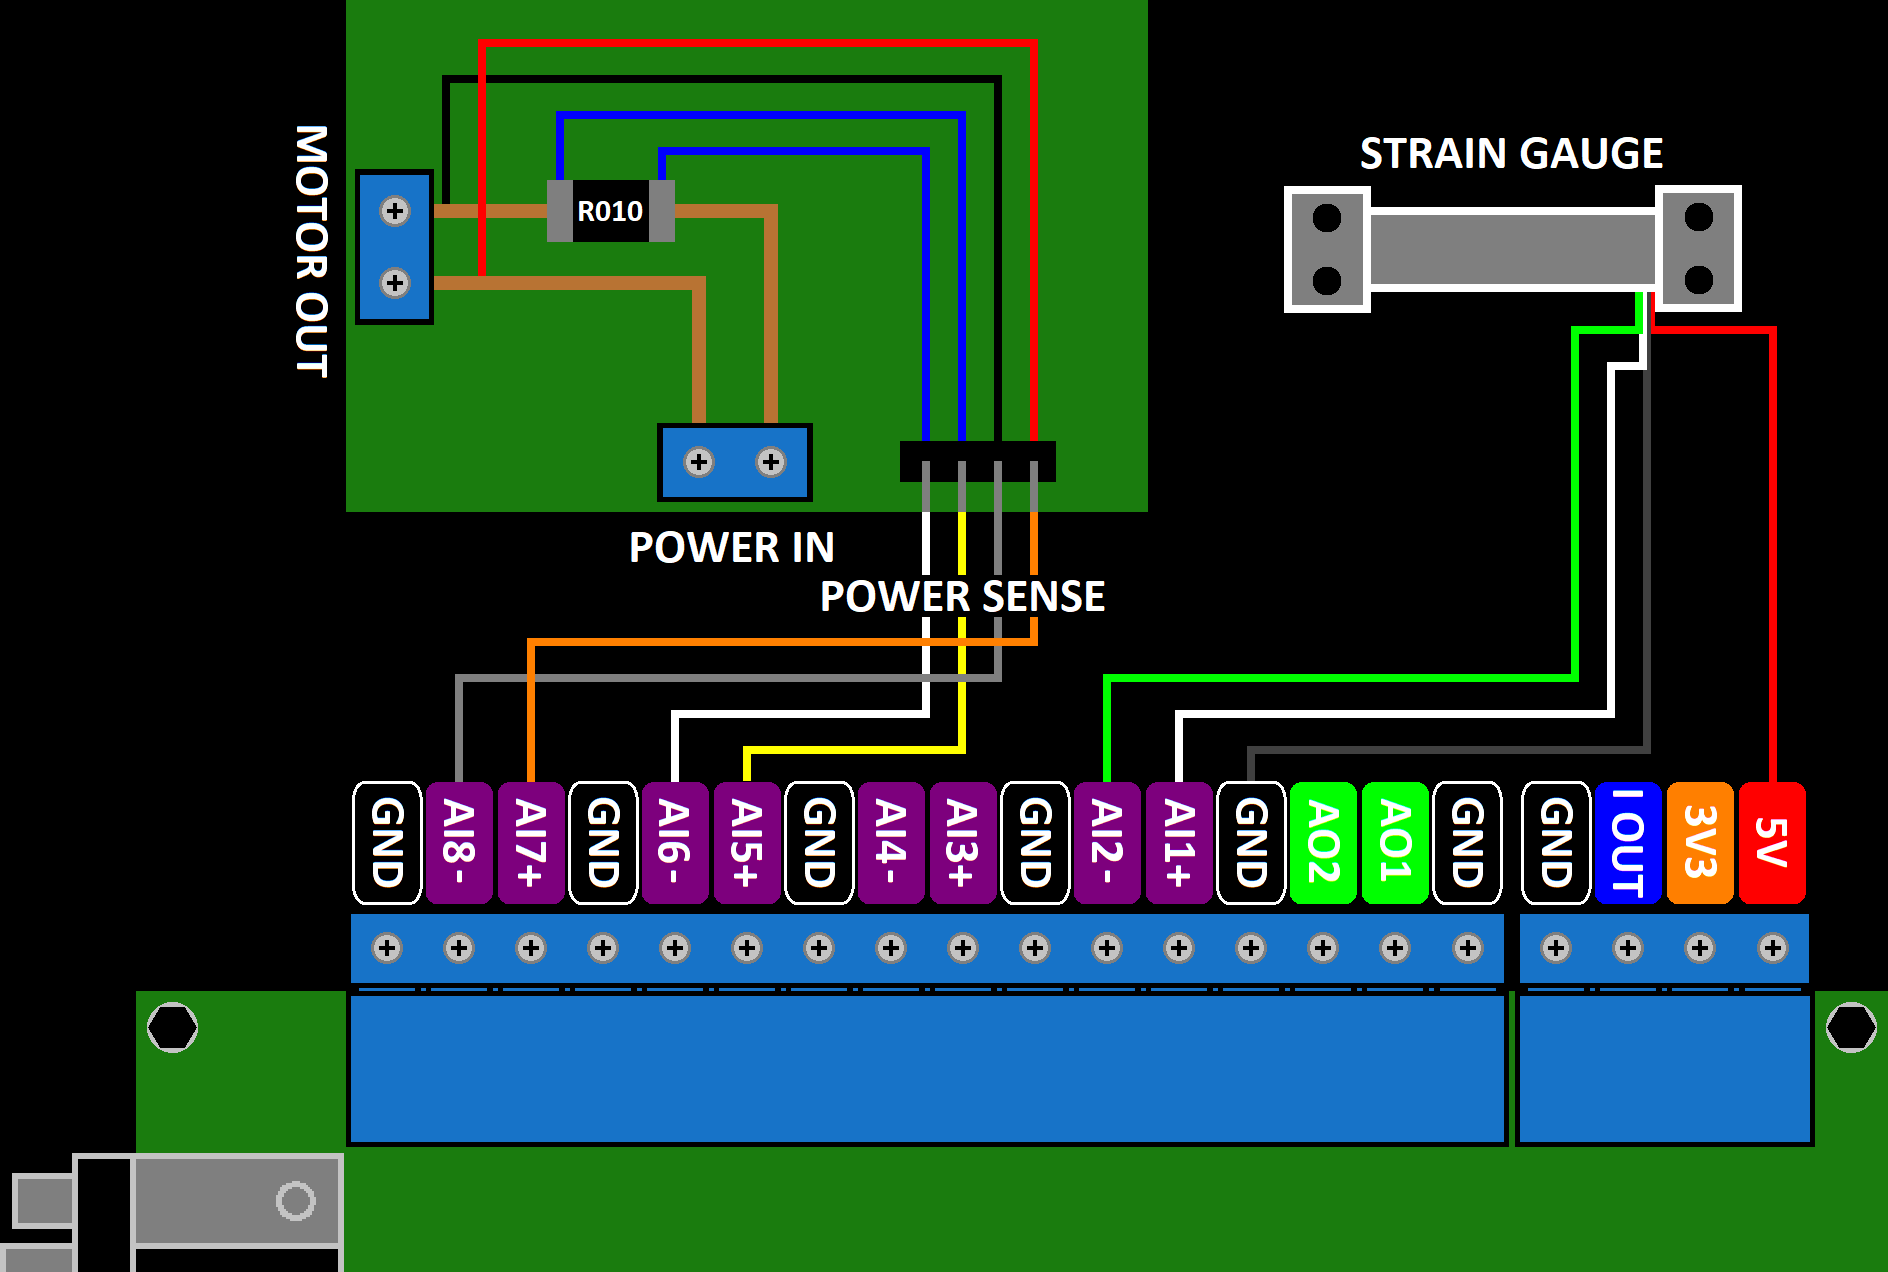
By using the STM32G4 DAQ, the circuitry is very simple as all the analog signal conditioning and conversion is done on the DAQ board. The strain gauge used is a 100g one from SparkFun and it is powered with 5V supplied by DAQ board. The differential output of the strain gauge, each arm of the wheatstone bridge, are connected to the differential analog input 1 (AI1+ & AI2-) of the DAQ. The strain gauge wheatstone bridge is well balanced, the output is very close to 0V differential when no force is applied, in the rest position. This avoids the need for offset compensation in hardware. The differential signal is amplified by the DAQ (gain of 128).
To measure both the voltage and the current supplied/consumed by the motor, a very simple PCB was soldered. The voltage is directly measured at the Motor Out point, again with a differential input of the DAQ (AI7+ & AI8-). The current is measured with a current sense resistor, with a value of 0.01 Ohm, with the differential voltage on its terminal measured by another differential input of the DAQ (AI5+ & AI6-). This signal is amplified by the DAQ (gain of 32).
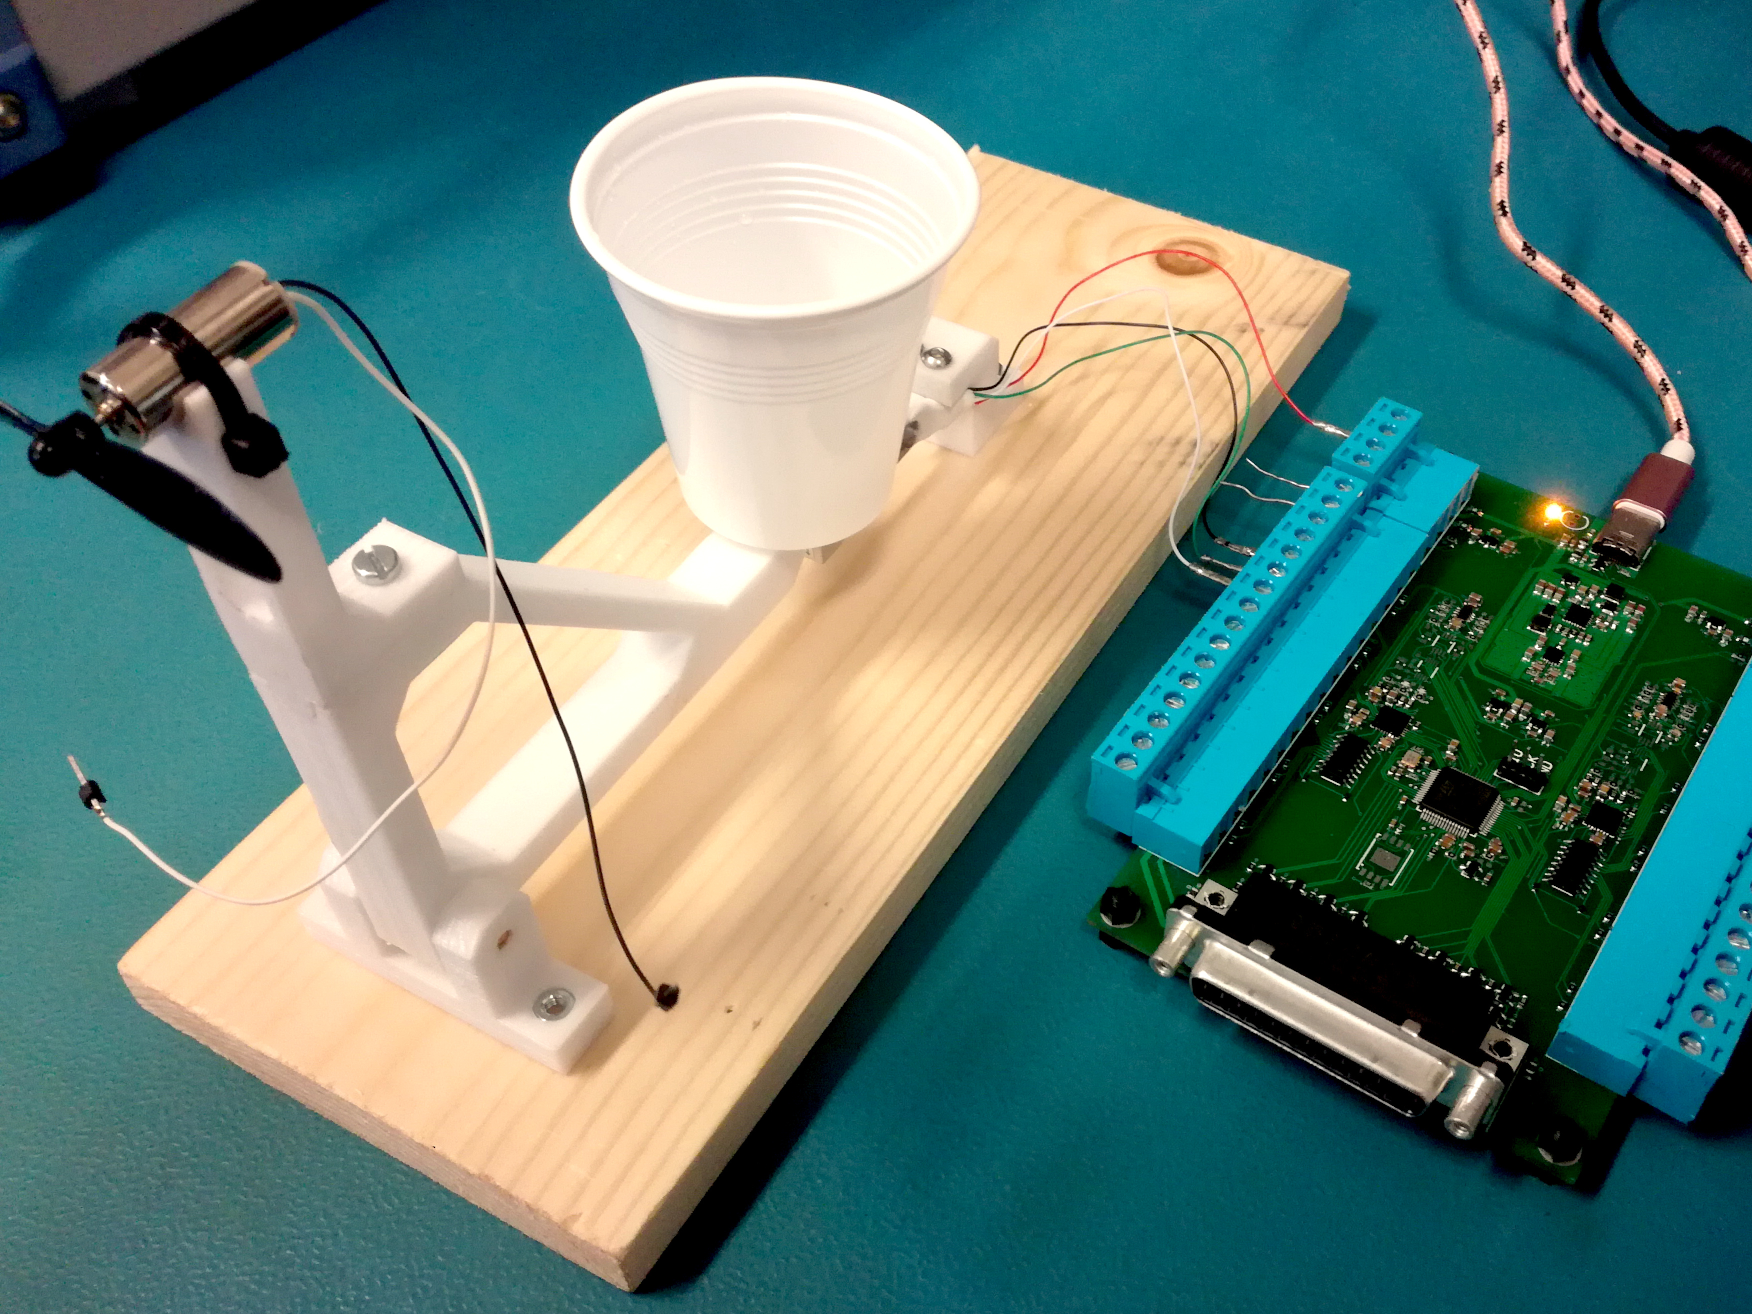
Bellow is a Figure showing all the connections and the simple Power Measurement PCB:
Calibration
To get the conversion factor, uV to grams, the strain gauge readout has to be calibrated. This is done by using different known masses and reading the output voltage of the strain gauge to trace a conversion curve. The calibration masses used here was a cup with water, which works pretty well and is easy to use. Water was added to the cup with a syringe so that precise amounts could be added. The standard 1 ml is 1 gram ratio was used and the calibration test was performed with two different set-ups:
Standing: Here the cup is placed on top of the strain gauge, as can be seen in the figure bellow:
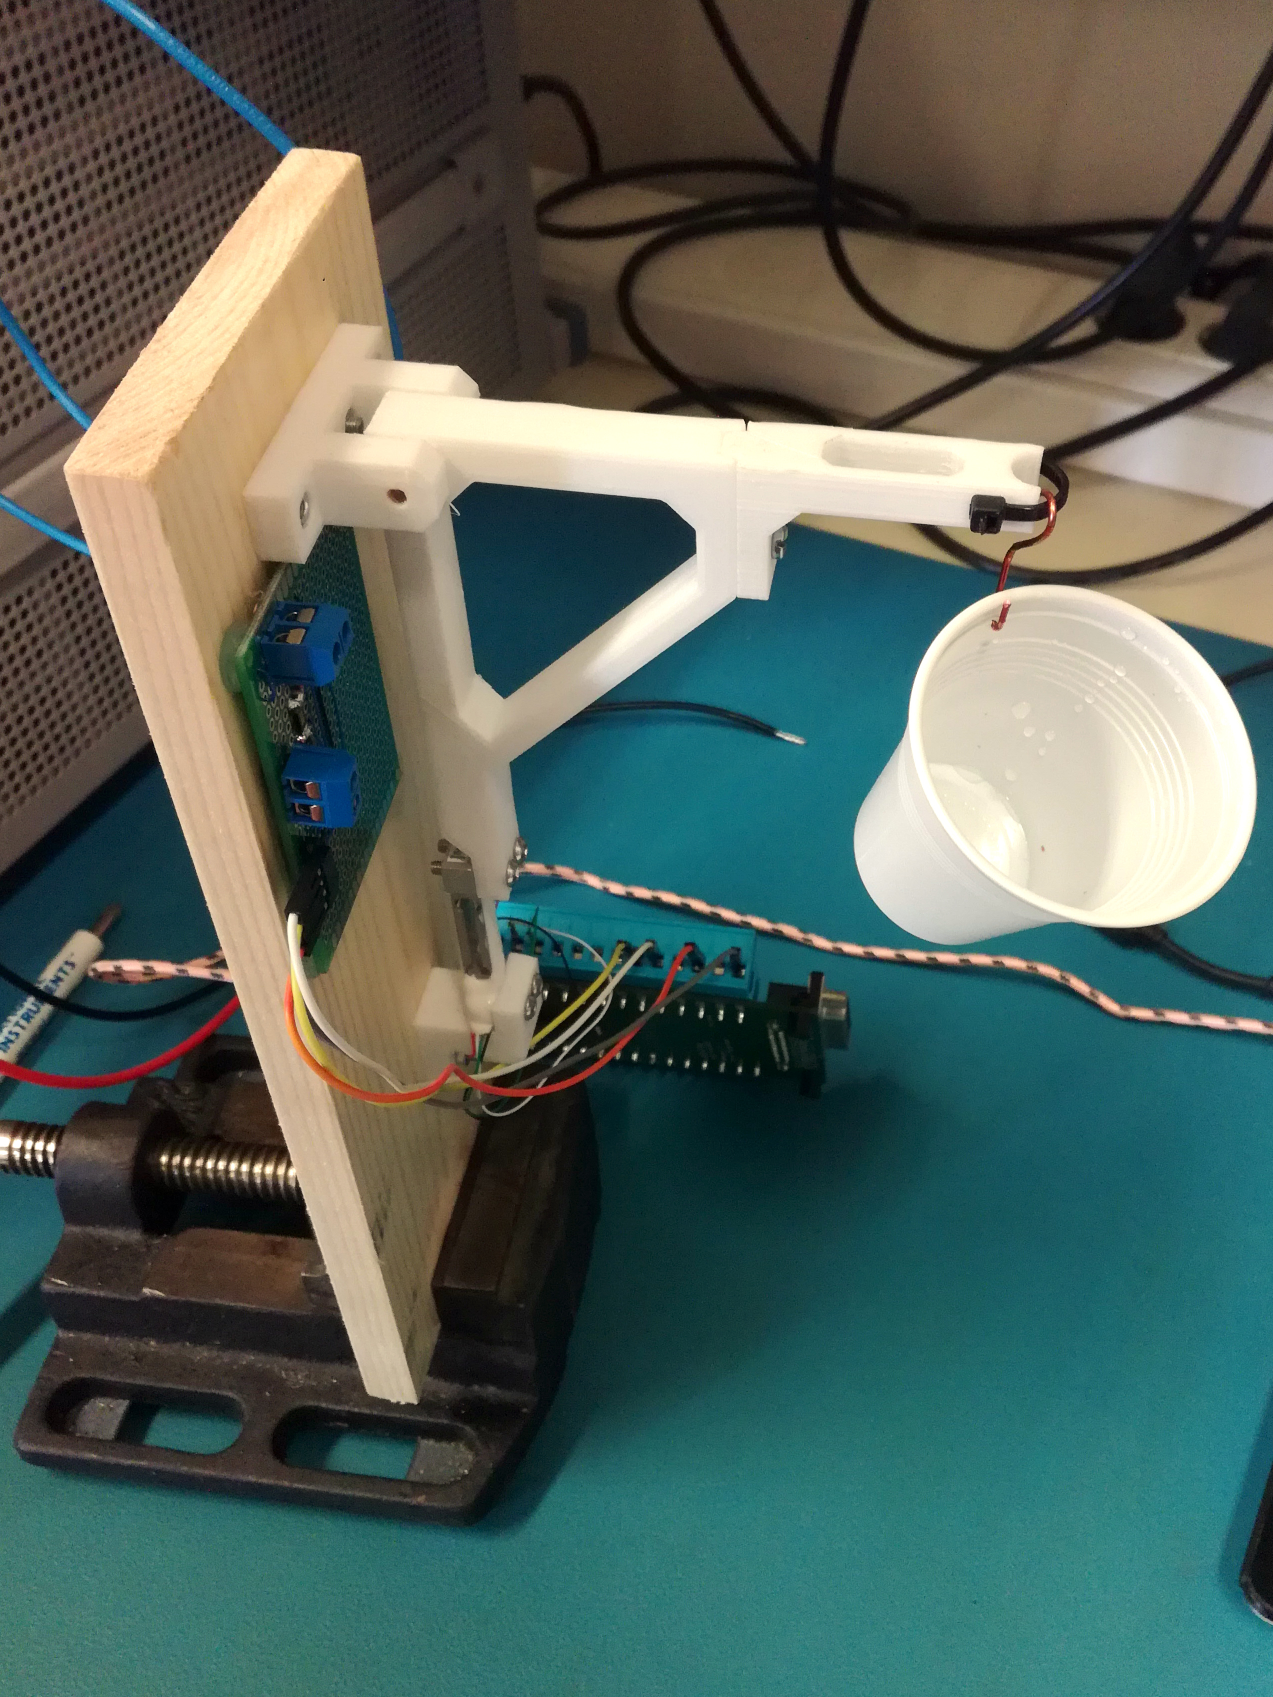
Hanging: Here the cup is hanged from the motor holder, simulating the thrust force of the motor + propeller, as shown in the figure bellow:
The obtained calibration/conversion curve can be seen in the figure bellow. In blue is the curve for the cup standing on top of the strain gauge and in red for the hanging cup set-up.
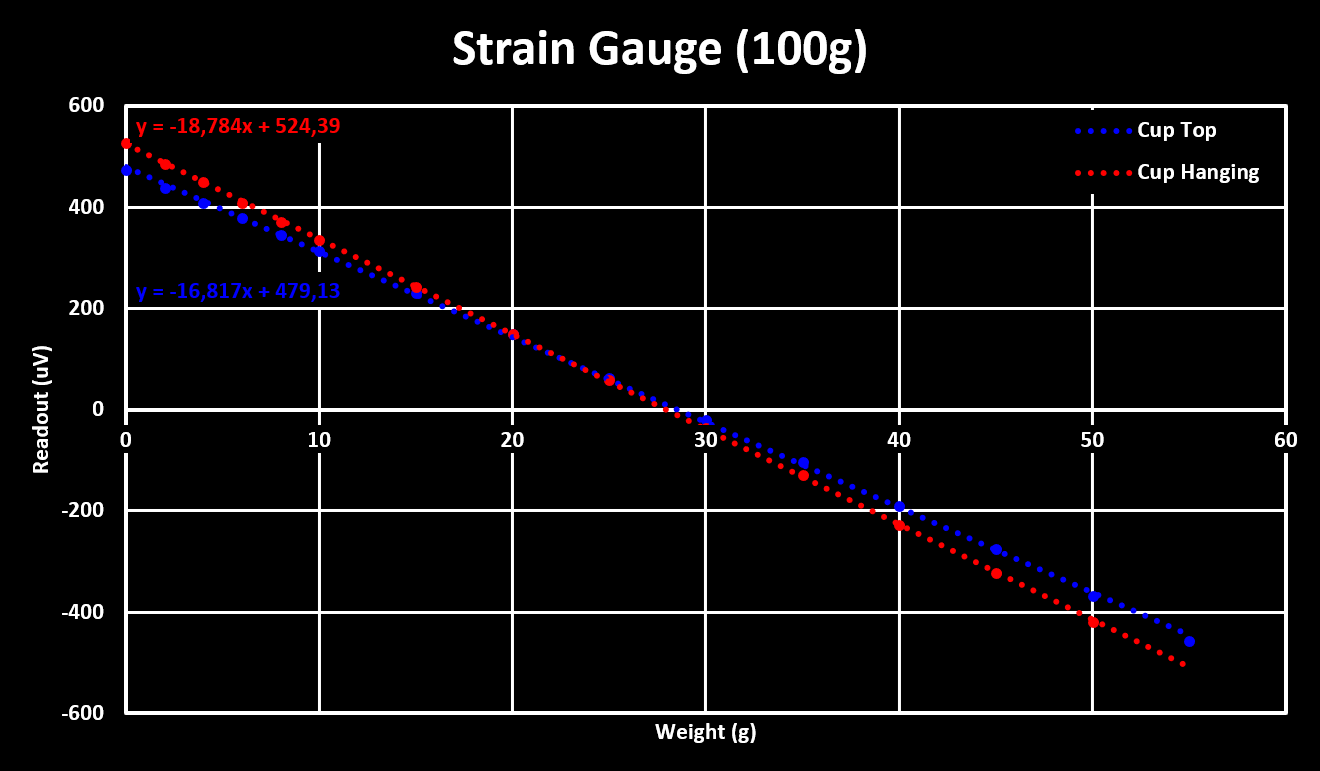
It is visible that the characteristics of the strain gauge is very linear, as expected, which simplifies the uV to gram conversion as only the slope of the linear trend line has to be used. The initial value/offset is not relevant as it will be calibrated for every experiment, like the TARA on a weight scale. The slopes for both set-ups are slightly different, which is expected due to losses and other not ideal force transfer, the value used for thrust experiments is from the hanging cup set-up (18.784 uV/gram). Also, the sign of both the slope and initial value/offset depend on the strain gauge wiring to the DAQ, if the two readout wires are crossed the sign inverts.
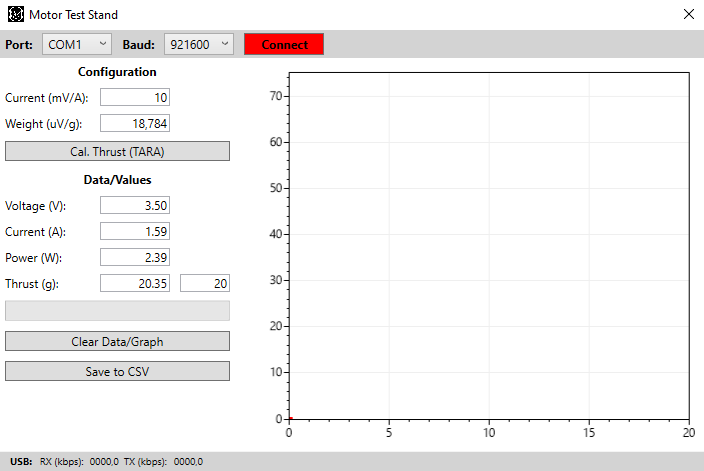
The PC software is written in C# and uses WPF and ScottPlot to create the GUI interface. To interface with the DAQ the developed C# library from the STM32G4 DAQ project is used. The software allows changing both the voltage to current and voltage to weight/thrust conversion factors. It also features a button that calibrates the initial offset (TARA), saves and then subtracts from the strain gauge readout the rest position value.
Voltage, current and thrust are acquired at a ~1kHz sampling rate, shared between all three channels. The average of the last 100 points is calculated every 500ms, which are the values displayed and saved. The power vs thrust graph is updated in real time and up to 512 points are saved internally and can be exported/saved to a CSV file.
The figure bellow shows the GUI/Interface of the PC software:
The Visual Studio Project can be downloaded from here: Motor_Test_Stand_PC.zip
The tested Coreless motor are:
- Generic 8520 (8.5mm x 20mm) bought from eBay.
- T-Power 8520 bought from AliExpress
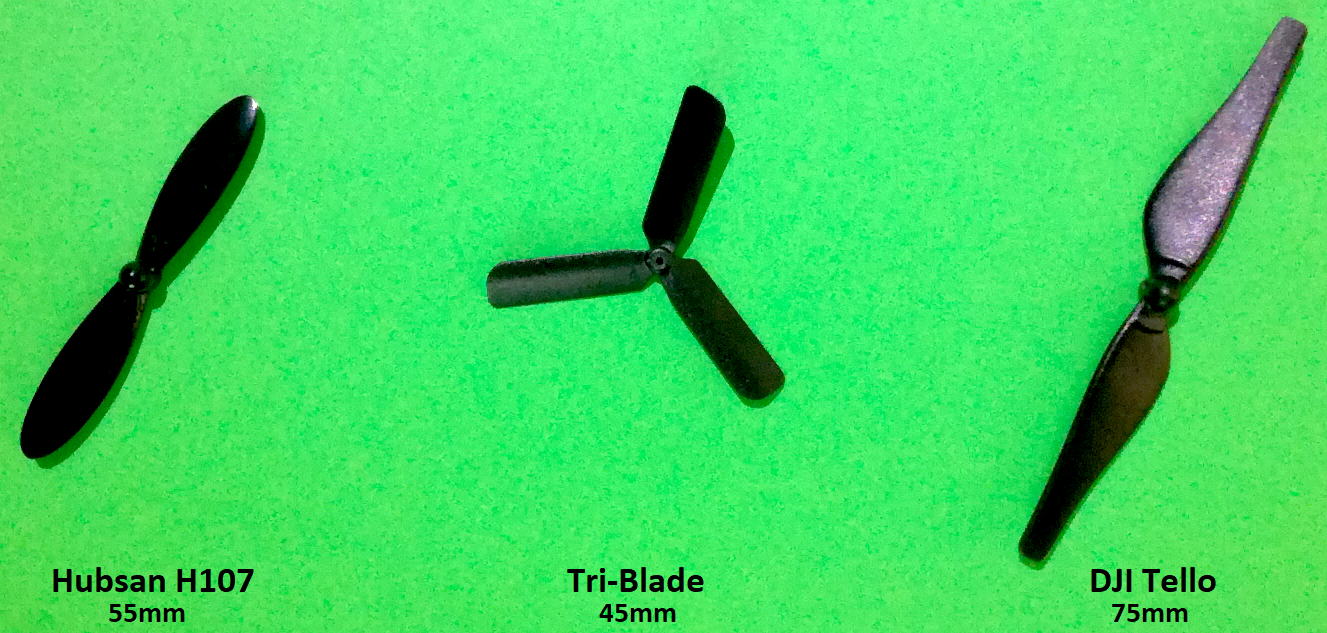
These were tested with three different propellers:
- Hubsan H107 propeller (55mm)
- Generic Tri-Blade 45mm
- DJI Tello propeller (75mm)
All of them are replacement parts bought from eBay/AliExpress, not originals. The three different propellers are shown in the figure bellow:
Generic Coreless 8520 Motor
Bellow are the thrust and power vs voltage curves for each of the propellers with the generic 8520 motor. The green highlighted area is the normal operation voltage range when using a 1S LiPo, from 3.5V to 4.2V:
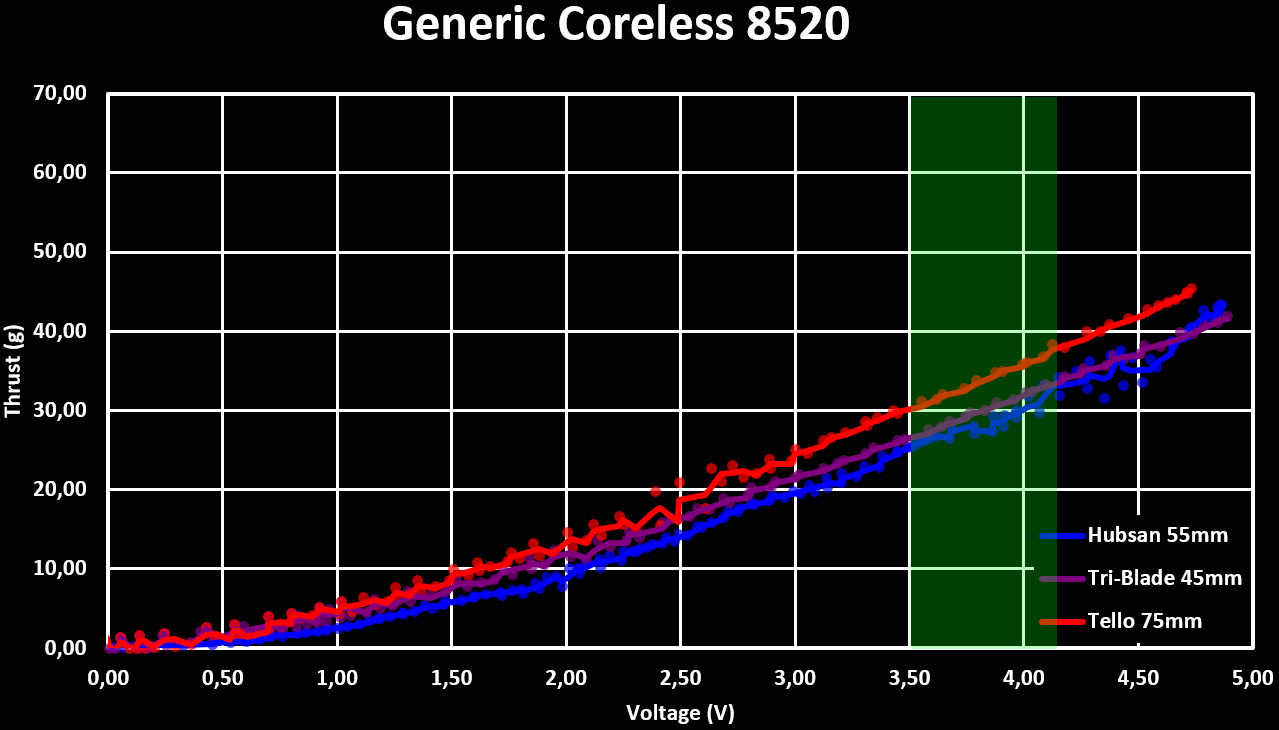
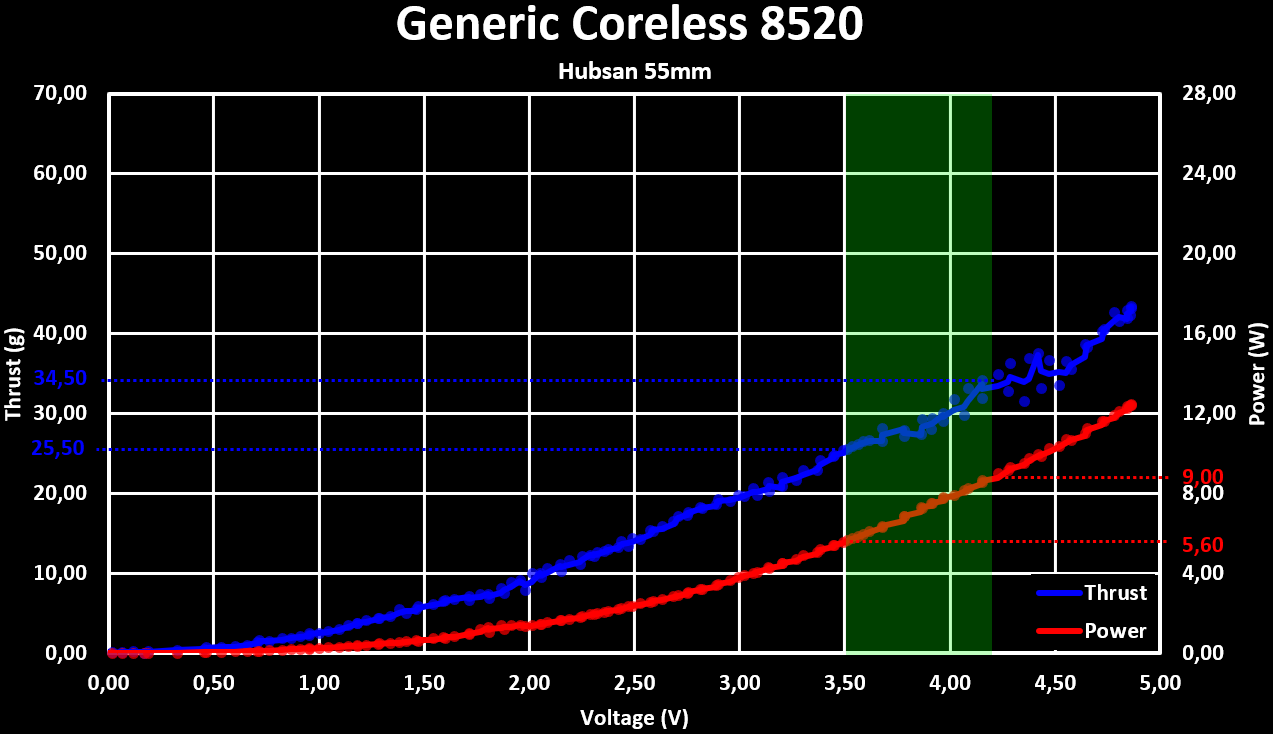
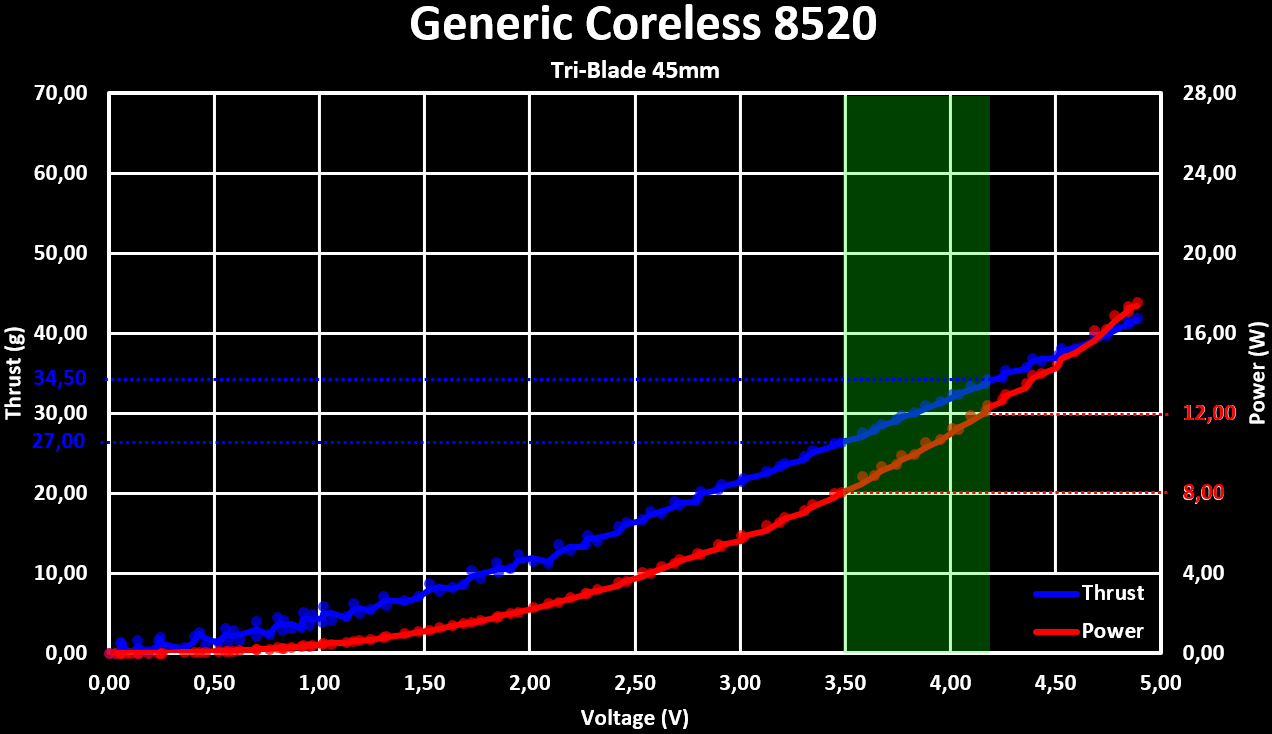
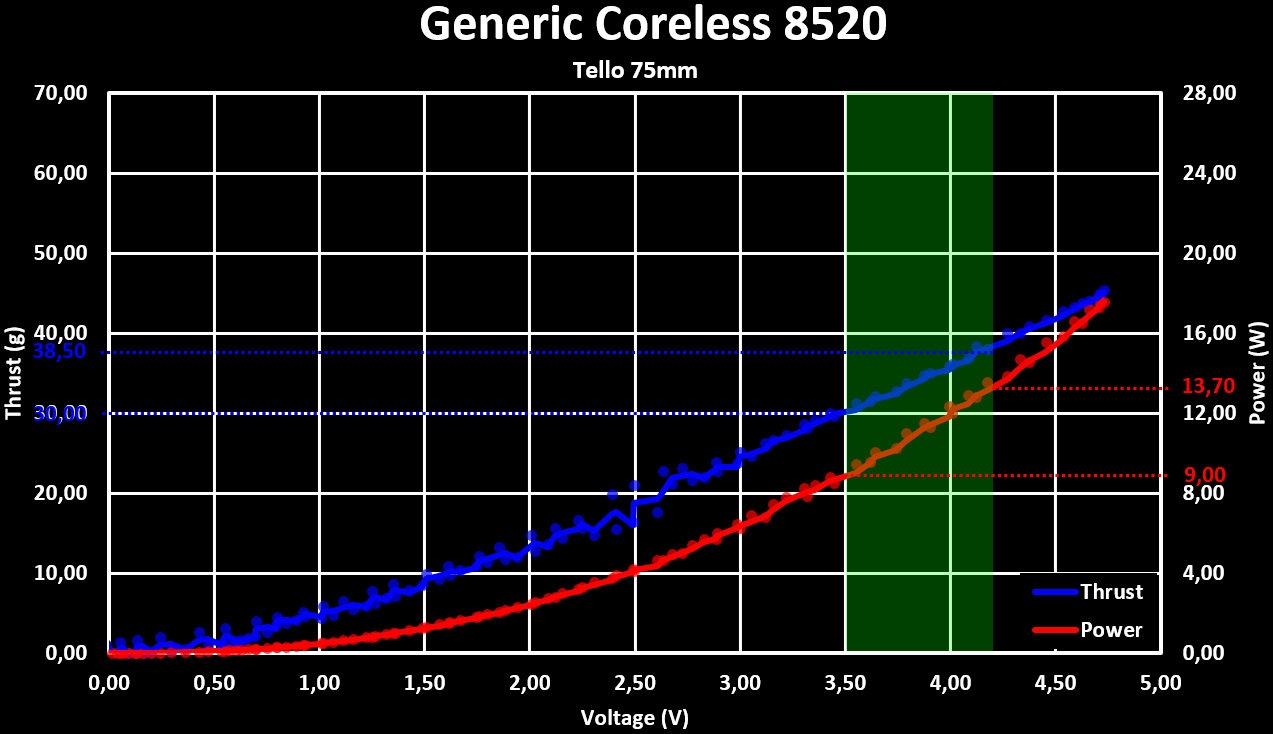
It can be seen that the most thrust is achieved with the Tello propeller, and that both the Hubsan H107 and the generic Tri-Blade propellers give very similar thrust. The Hubsan H107 gets the best efficiency out of the three, between 4 to 5 grams/Watt in the normal operation range:
Another experiment done was testing the thrust vs PWM duty cycle. For this, the Power In was connected to a simple low side MOSFET motor driver that was controlled by a PWM signal. This test was done with the Hubsan H107 propeller and with a 4V supply voltage. The test was performed with the PWM duty cycle slowly increasing over time, from 0% (OFF) to 100% (Full ON), as can be seen in the figure bellow. The graph is over time, with the PWM change over time displayed on top of the graph:
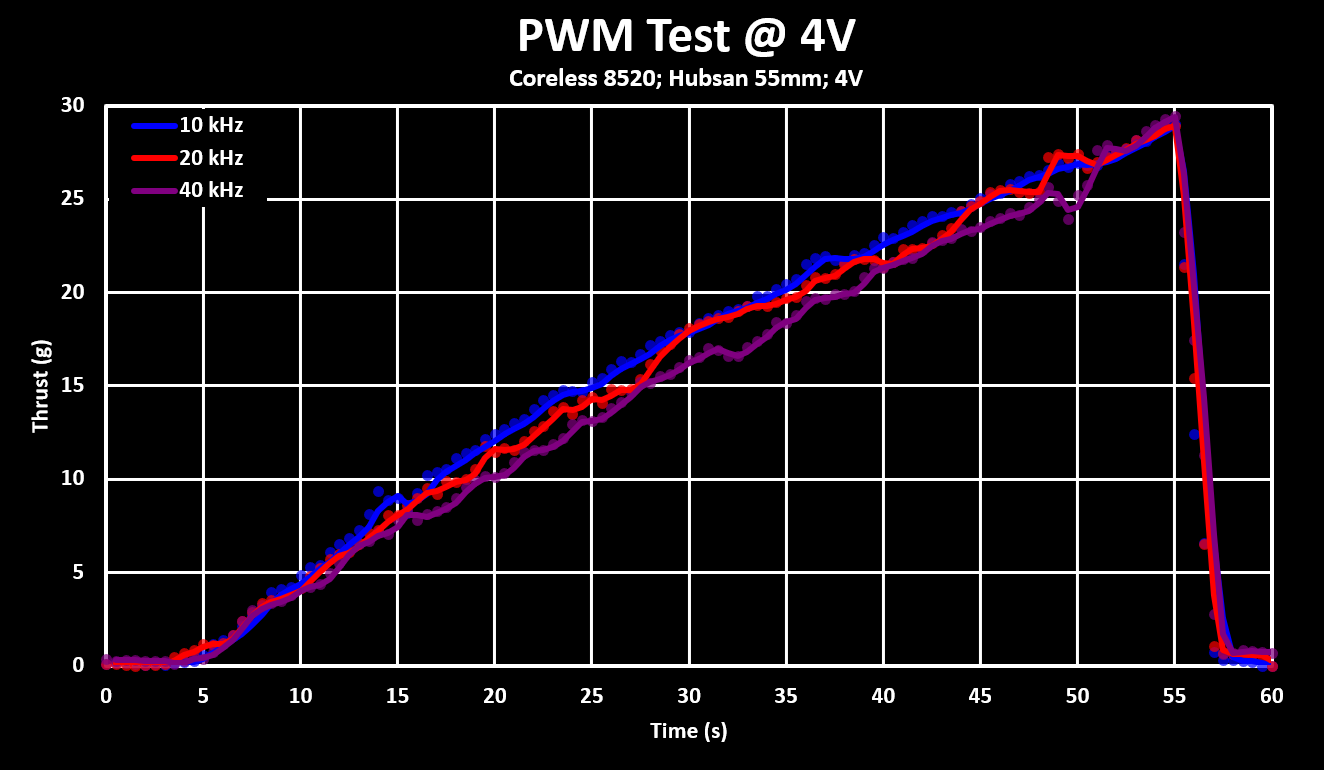
The test was performed with three different PWM frequencies to see its effect. For the three tested PWM frequencies and the used motor driver, no significant difference were seen between the different frequencies, besides audible wining @ 10 kHz. The graph also shows that the thrust vs PWM Duty Cycle is very linear, which is good for easier/better controller performance.
T-Power Coreless 8520 Motor
Bellow are the thrust and power vs voltage curves for each of the propellers with the T-Power 8520 motor. The green highlighted area is the normal operation voltage range when using a 1S LiPo, from 3.5V to 4.2V:
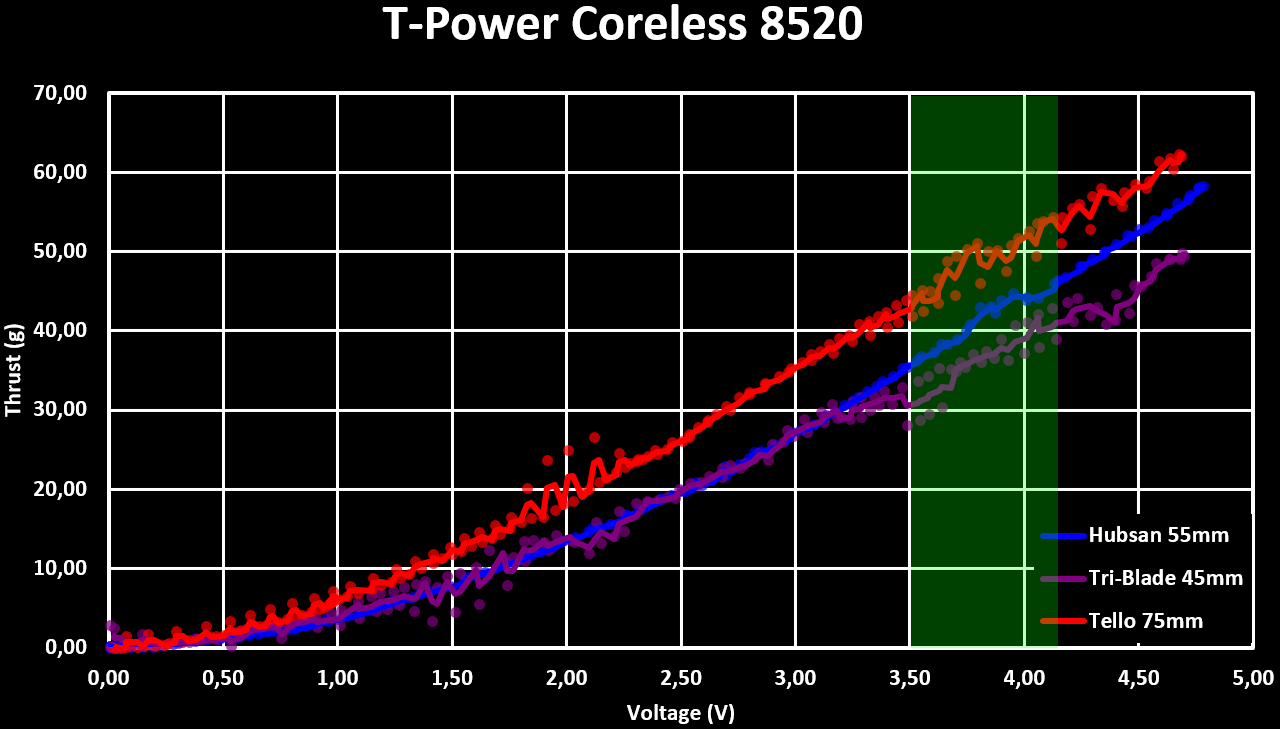
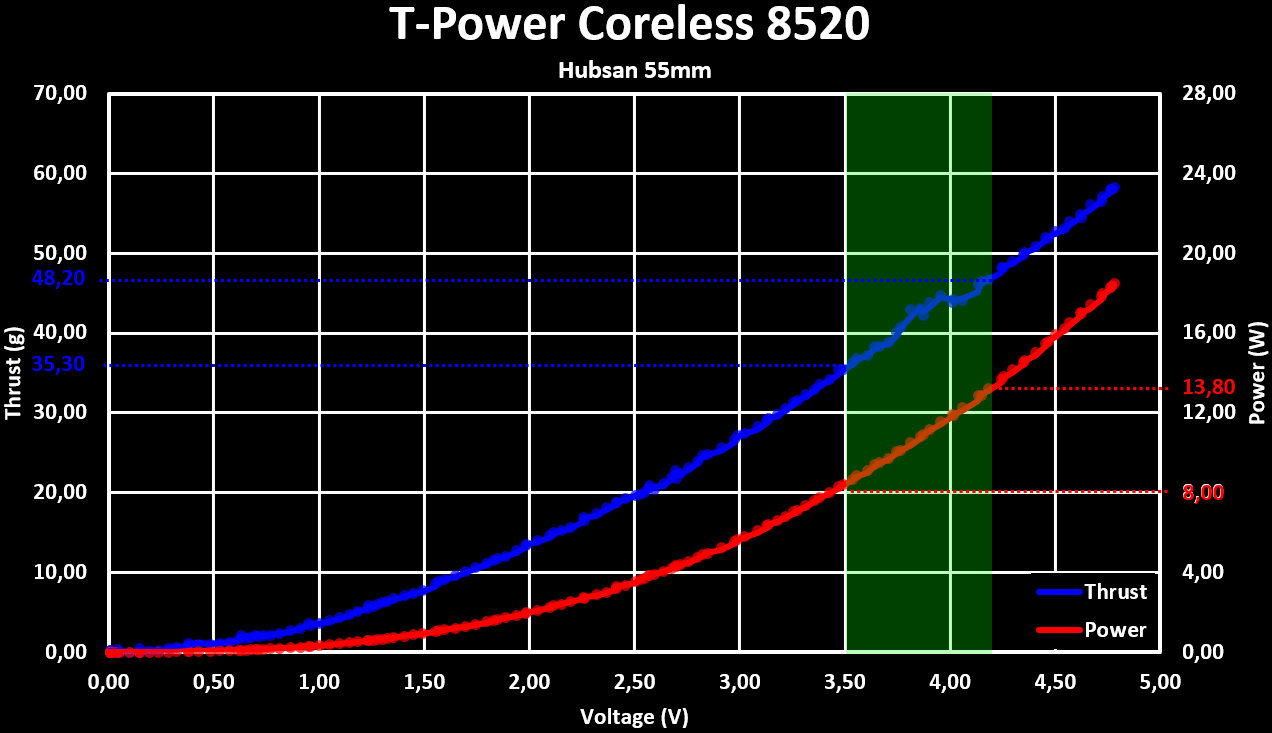
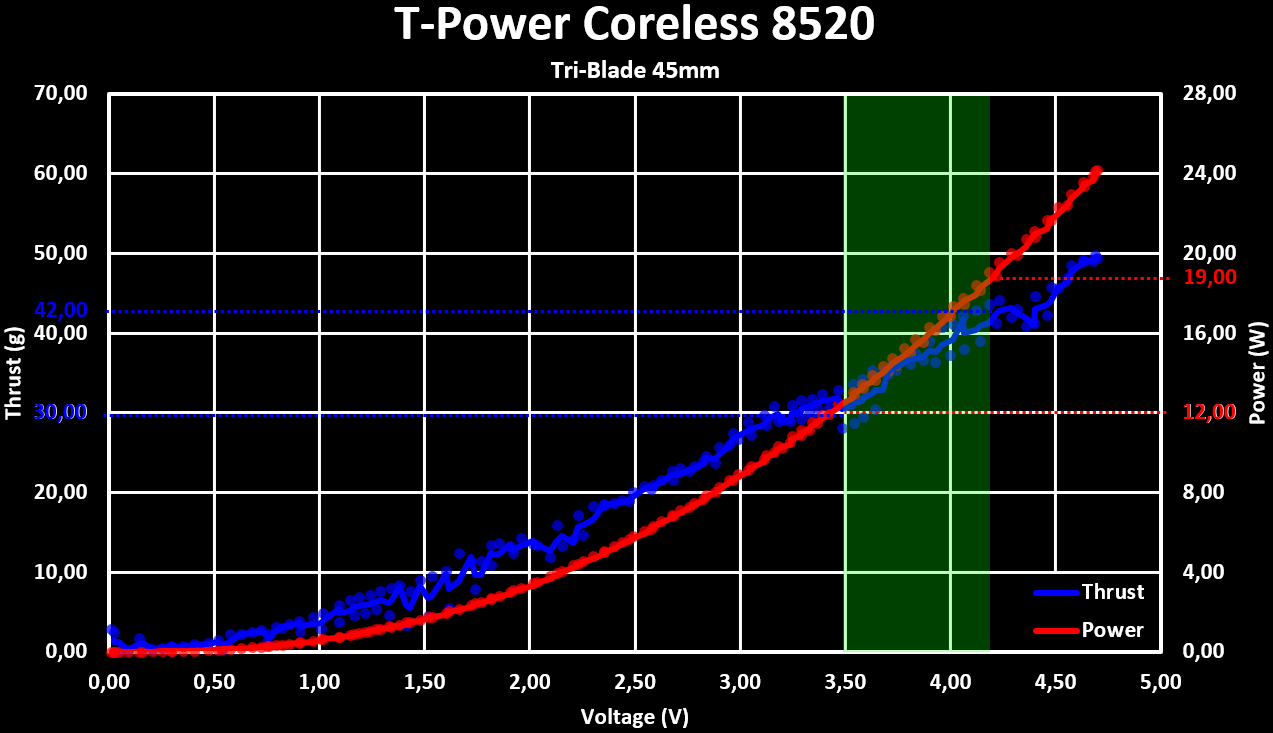
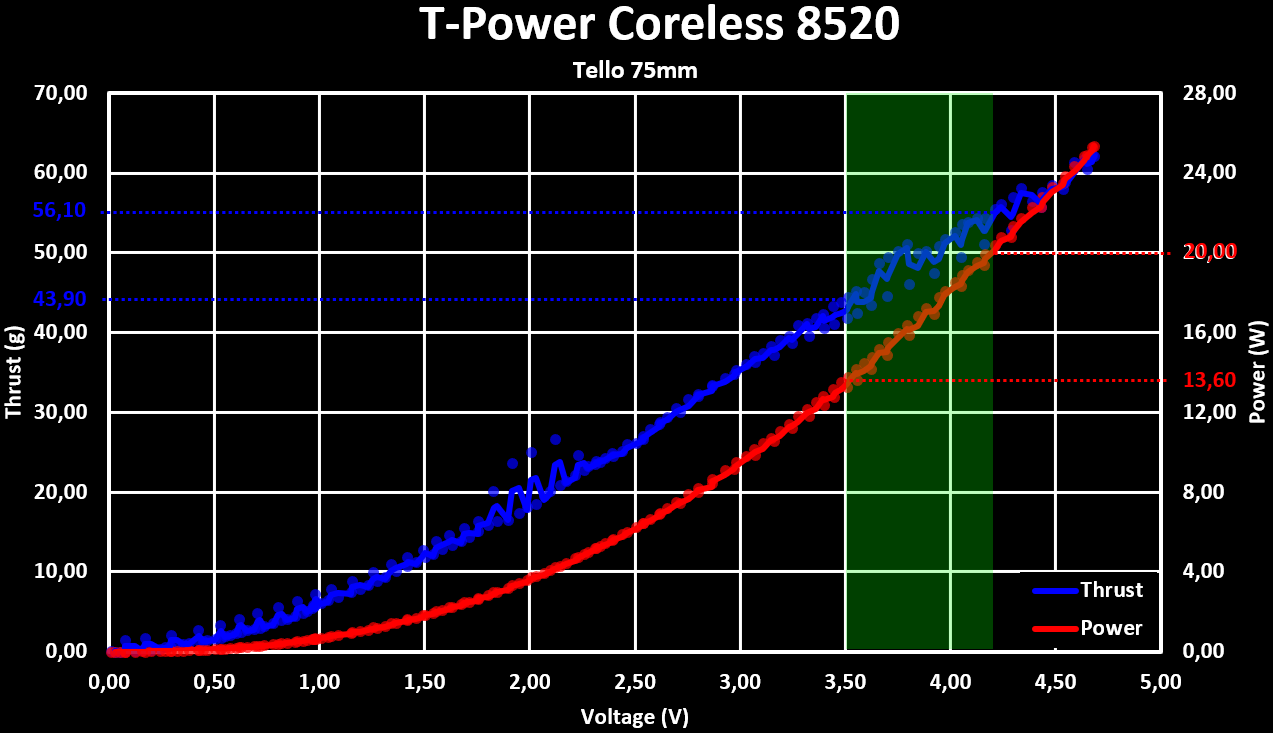
The T-Power 8520 motor gives significantly more thrust then the generic one, with any of the tested propellers. It also consumes significantly more, achieving more or less the same efficiency. The higher power consumption is also noticeable by the motors warming up, which the generic one barely did.